AGRONOMIC RESOURCESTO SUPPORT EVERY SEASON
YOU CAN TAKETO THE FIELD
Interpreting Soil Test Results
As 2020 draws to a close and we begin to lay out plans for 2021, it is always a good idea, in any year at this time, to look back at our soil samples. If your samples are older than 3-4 years, it is time to pull some new samples. Soil samples not only help us look at fertility levels and better allocate our fertilizer investments, but they also give insight on productivity of the soil. Here are some key categories on a soils test result, what it means and how to manage it.
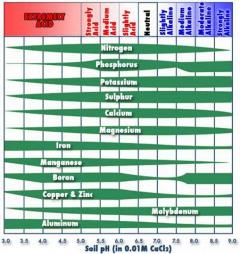
The pH measures the level of acidity in the soil and plays a key role in the availability of nutrients to the plant. When soil pH drops to 5.0, nutrients such as Phosphorus, Calcium and Magnesium become less available and can cause deficiency in the plant, regardless of how much MAP or DAP is applied. In fact, I have seen soil samples where many years of low pH has caused high levels of Phosphorus to build up because the plant is not able pull it from the soil and Phosphorus was able to build up with low crop removal. This resulted in visible phosphorus deficiency and lower yields despite the high soil phosphorus. Soil pH also affects the longevity of many residual herbicides. Different crops prefer different pH levels. Corn and soybeans like a soil pH of 6.5, and Alfalfa prefers 6.8. Low pH can be fixed with applications of ag lime. When the pH drops to about 6.0 for corn/soybeans, and 6.2 for alfalfa, lime should be applied.
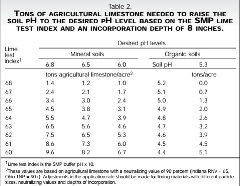
Soil pH indicates when lime should be applied but does not indicate how much. This is where the LTI, or buffer pH, are consulted. Some soil tests report buffer pH and can be converted by multiplying by 10. (buffer pH 6.8 x 10 = 68 LTI) the LTI measures the buffer of the soil, which basically tells how resistant to change a soil is. For example, soil with a high buffer, requires more lime to change the pH and a low buffer soil requires less lime. If lime recommendations are above 4 tons/acre, then it should be split into 2 applications.
Cation Exchange Capacity (CEC):
CEC is one of the most important properties when determining nutrient availability and retaining those nutrients. The CEC measures the total holding capacity of positive charged nutrients such as Potassium, Calcium, Magnesium, and Sodium. CEC is used to determine Potassium requirements for crop production.
Organic Matter (OM):
OM is the organic content of the soil, measured as a percentage. It is comprised of dead organisms (both plant and microorganisms) that are in varying levels of decay. OM helps to improve moisture retention and nutrient holding capacity.
P, K, Ca, Mg:
These nutrients are expressed as parts per million (ppm) or pounds per acre (lbs/A). To convert ppm to lbs/A, just multiply ppm by 2. Fertility levels are determined by local land grant universities using Tri-State recommendations (Ohio, Michigan, and Indiana). “Critical levels” are used, which indicate nutrient levels that, when below the critical level, nutrient deficiencies can occur. Above critical level, the is no economic gain of additional fertilizer beyond crop removal. Nutrient levels above the critical level are in maintenance range and nutrient applications are based on crop removal. For Phosphorus (P) the critical level is 30 lbs/A for corn-soybean rotation and 50 lbs/A if alfalfa or wheat is in the rotation. Potassium (K) critical levels are determined by CEC. Lower CEC soils have less capacity to hold nutrients and have lower critical levels. A CEC of 5 meq/100g) have a critical level of 175 lbs/A while a CEC of 20 meqs/100g will have a critical level of 250 lbs/A. Calcium (Ca) and Magnesium (Mg) for the most part, are easily maintained with proper pH and balanced fertility. Critical level of Ca is 400 lbs/A and Mg is 100 lbs/A.
Ca/Mg:
This provides the ratio of calcium to magnesium and is used when determining lime source if pH is too low. If the ratio is less than 1:1, where there is less Ca than Mg, than a high calcium lime should be used.
Mg/K:
This is another ratio that measures the balance of magnesium to potassium. When K levels become excessive, Mg can be tied up. A ratio of less than 2:1 (Mg:K) would require an application of Mg. this is more important in forage crops where low levels of Mg can cause grass tetany, milk fever and hypocalcemia in livestock. This is usually not an issue when proper K levels and pH are achieved.
With soil testing every few years, we can monitor our soils levels and make sure we are not wasting money on excessive fertilizer but are better able to handle high yielding genetics. Well balanced nutrients and pH can not only help ensure high yields but also drought tolerance, stalk integrity, and crop quality. Using previous yield maps and Advantage Acre®, in addition to soil test results, we can improve our fertilizer plans for the 2020 crop year to ensure adequate crop removal rates and maximize our fertilizer ROI.
Sources and additional information:
Tri-State Fertilizer Recommendations for Corn, Soybeans, Wheat & Alfalfa
Soil Fertility and Fertilizers by John L. Havlin, Samuel L. Tisdale, James D Beaton and Werner L. Nelson
Download a copy of this technical bulletin here: Interpreting Soil Test Results


Technical Team Agronomist